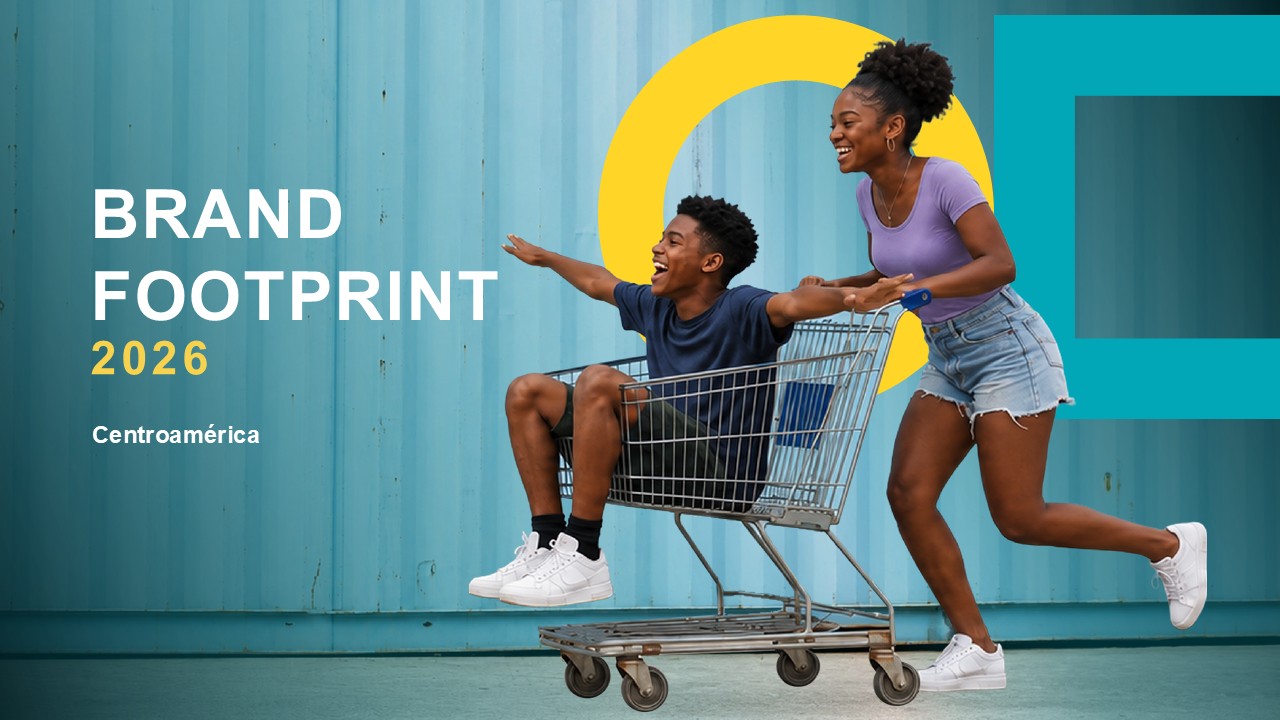
Man pushing smiling woman sitting in shopping cart in front of large yellow circle on teal background.

Brand Footprint 2026

The FMCG brand the world’s shoppers chose most often, market by market.
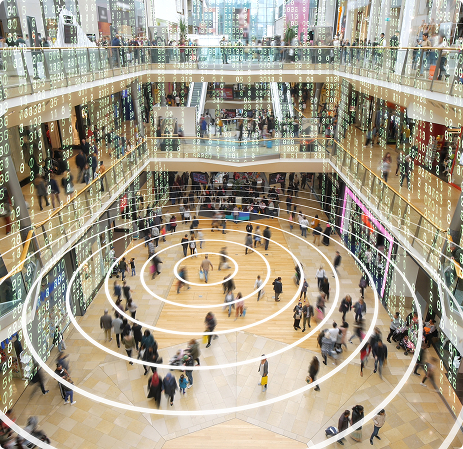
Crowded modern multi-level shopping mall with concentric circles and code overlay suggesting digital data.

When everything costs more, what still earns a place in the basket?

Regional conflict, shifting supply chains, sticky inflation and high borrowing costs: the pinch is being felt from the factory floor to the family kitchen.


But shoppers aren't simply trading down – they're trading carefully, protecting small luxuries and stretching everyday essentials while making every brand justify its place.

This year's Brand Footprint explores who is winning that argument, market by market.

Register your interest
Top-down view of diverse people walking on a blue grid patterned ground with colorful lines.

Growth still starts with a new shopper

You wouldn't expect France, Brazil and Central America to have much in common, and yet their reports keep arriving at the same conclusion. Eight in ten growing French  brands added new households last year, as did seven in ten of Brazil's. In Central America, the share of growing brands managing it on recruitment alone climbed from 29% to 45% in a year.
‍
Persuading existing buyers to come back more often helps, but it is usually a new household arriving that does the heavy lifting.

Explore the local reports
Dois colegas a sorrir e a trabalhar juntos num computador portátil durante uma reunião num escritório moderno.

Brands don't win categories. They win moments.

The brands that climbed fastest this year were the ones a shopper could explain: the lunch that saves a trip to the café, the snack with protein in it, the drink that rescues a tired afternoon, the spray that finally shifts the limescale.

What the Central American data adds is that those jobs cut across the aisles, so brands are increasingly competing for the same household budget and the same occasions rather than the same shelf.

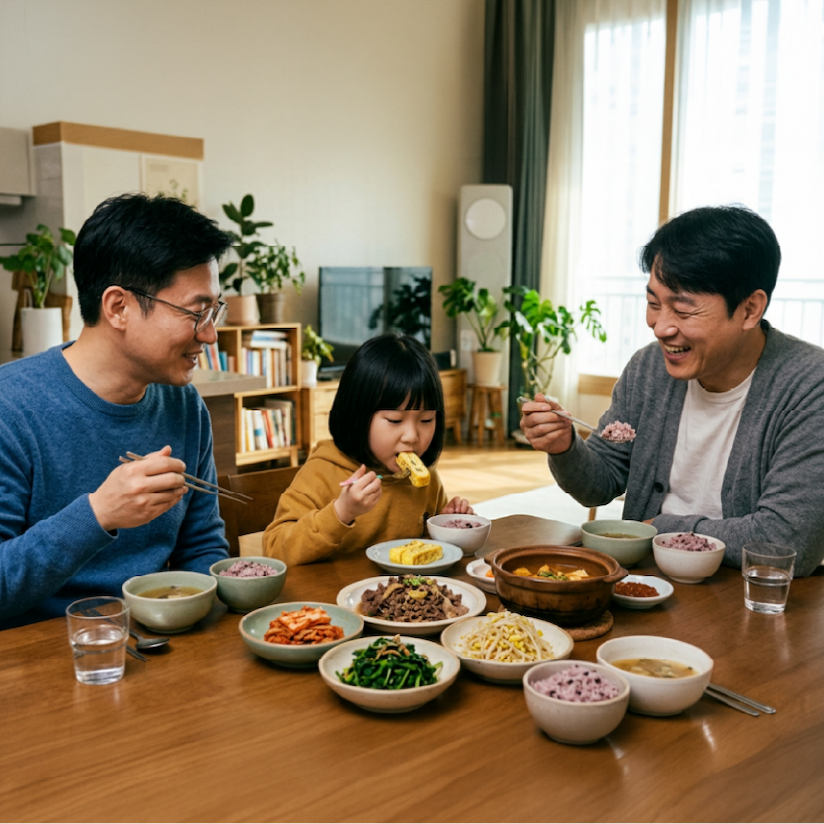
Uma família asiática composta por dois homens e uma menina, sentados à volta de uma mesa de madeira a saborear uma refeição juntos, com taças de arroz, sopa e vários acompanhamentos, numa sala de jantar luminosa com plantas e uma grande janela.

The brands closest to home are hardest to beat

Eight of Portugal's top ten brands are Portuguese and four of Ireland's top five carry Irish heritage, while seven in ten Saudi shoppers say they prefer local names. In Spain, the most chosen brand changes depending on which region you happen to be standing in.

Familiarity clearly counts for something, although it doesn't protect a brand by itself. The heritage names that grew were the ones that tied all that history to something a household needed this week.

The measure of being chosen

Brand Footprint is the annual ranking of the world's most chosen FMCG brands. It is built on Consumer Reach Points (CRPs) – a unique metric measuring how many households buy a brand and how often they choose it. One CRP equals one instance of a shopper choosing a brand, capturing real shopper decisions rather than sales value alone. Published by Worldpanel by Numerator and powered by billions of verified purchases.

How the ranking is built

A CRP is built from three numbers: how many households there are in a market, what share of them buy the brand over the year, and how often those households choose it. Multiply the three together and you have a brand's real footprint across categories, markets and continents — beverages, food, dairy, health and beauty, and homecare, in 58 markets covering over 85% of global GDP.

Seta para a direita
Seta para a direita
The most chosen brands in 2025, market by market
Brand Footprint 2026 looks at the brands households chose during2025. Choose a market and you can see which brands its shopperspicked most often, how many households bought them and how oftenthose households came back. Filter by sector to narrow it to thecategories where you compete.
Rank — where the brand sits in that market this year
Change in rank — places gained orlost since last year
CRP (m) — Consumer Reach Points,in millions: the number of times households chose this brand over theyear
CRP change — how much that numberhas grown or fallen year on year Penetration — the share ofhouseholds that bought the brand at least once Consumer choice — how many times abuying household chose it, on average
Brand Footprint stories across the globe
The global picture is built from the ground up. Driven by local intelligence and market expertise, each report is researched and written in-country by our on-the-ground teams—analyzing the precise brands their local shoppers chose. Many reports are available in their original language.

APAC

Coming soon
Register your interest
Frequently Asked Questions
What is Brand Footprint?
ícone de cruzeta para baixo
Brand Footprint is Worldpanel by Numerator's annual ranking of the most chosen FMCG brands in the world. It has run since 2013 and the 2026 edition is the fourteenth. It covers 58markets and in excess of 30,000 brands. The report measures how often households actually choose a brand rather than how much they spend on it.
What is the ranking based on?
ícone de cruzeta para baixo
The ranking is based on Consumer Reach Points. One Consumer Reach Point is a single instance of a household choosing a brand, so a household that buys a brand twelve times a year generates twelve of them. The measure combines how many households buy a brand with how often they choose it.
How is this different from market share or sales data?
ícone de cruzeta para baixo
Sales data measures money, whereas Brand Footprint measures decisions. A brand that raises its prices will gain value share without gaining a single Consumer Reach Point, because the count only moves when more households buy the brand or existing buyers choose it more often. It is closer to a measure of how many people a brand reaches than of how much it earns.
Where does the data come from?
ícone de cruzeta para baixo
Most of it comes from Worldpanel by Numerator's continuous purchase panels, where participating households record everything they bring into the home, week after week. Markets outside that footprint are covered by partner panels: Numerator, Europanel and YouGov The methodology page sets out the sources in full.
Which brands and categories are included?
ícone de cruzeta para baixo
The ranking covers consumer brands across five FMCG sectors: beverages, food, dairy, health and beauty, and homecare. Retailers' own-label ranges are excluded, as are non-barcoded fresh food, batteries and pet food. Only purchases brought into the home are counted, so anything eaten or drunk out of home sits outside the ranking.
What period does the 2026 edition cover?
ícone de cruzeta para baixo
The 2026 edition reports on purchases made during 2025, specifically the 52 weeks to October 2025. That is why the tables are labelled 2025 and compared against 2024. Each edition takes its name from the year it is published rather than the year it measures.
Why isn't my brand in the ranking?
ícone de cruzeta para baixo
There are a few common reasons. Own-label ranges are excluded, as are categories outside the five sectors covered. A brand may also sit below the published table, which is usually a top 50. The global table adds a further condition, which is that a brand has to be present on at least three continents to qualify
Can I find out where my brand ranked?
ícone de cruzeta para baixo
Yes. The interactive table on the Brand Footprint page lets you search the published rankings by market and by sector. If your brand sits outside the published table, or you want the detail behind its position, get in touch and we can take you through it.
Why has a figure changed since last year's report?
ícone de cruzeta para baixo
Panels are improved over time and historic data is restated as coverage changes, so a figure may differ slightly from the version published a year earlier. The current edition is always the most accurate. Year-on-year comparisons are therefore safest taken from within a single edition.
Are there reports for other countries and regions?
ícone de cruzeta para baixo
Yes. Alongside the global report there are regional reports and individual country reports, each written by the team in that market. They are linked from the Brand Footprint page, and several are published in the local language.
What do penetration and consumer choice mean?
ícone de cruzeta para baixo
Penetration is the share of households that bought a brand at least once during the year. Consumer choice is how many times, on average, a buying household chose it. A brand can grow by improving either one, and comparing the two columns shows which of them did the work.
Still have a question?
ícone de cruzeta para baixo
At Worldpanel we welcome questions about our data. If your question isn't answered here, or you would like to understand how your own brand has performed, please contact David Chapman, Senior Manager, Global Insight-led Content and Thought Leadership, at David.Chapman@wp.numerator.com

Want to know how your brand earns its place in the basket?

Leave your details below and one of our experts will be in touch.
Acrescente algum contexto adicional com este texto auxiliar
ícone de cruzeta para baixo
Obrigado! A sua candidatura foi recebida!
Ops! Algo correu mal ao submeter o formulário.